
 Print
Print
|
|
|
|
Reports
The Reports tab allows you to view reports by minute, hour, or day. You can choose from all or a single part program. A date/time range picker is provided to limit the report to a specific period. The Quick Select drop-down menu allows you to choose a time period of the last 24 hours, today's data (until the snapshot time), or all available data.
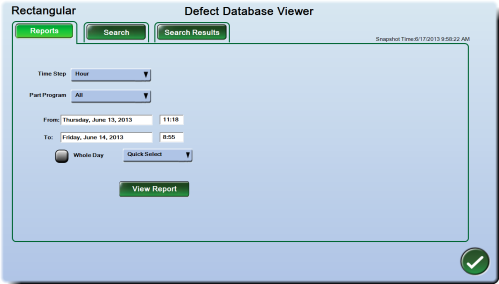
Click the View Report button to see the report from the selected criteria.
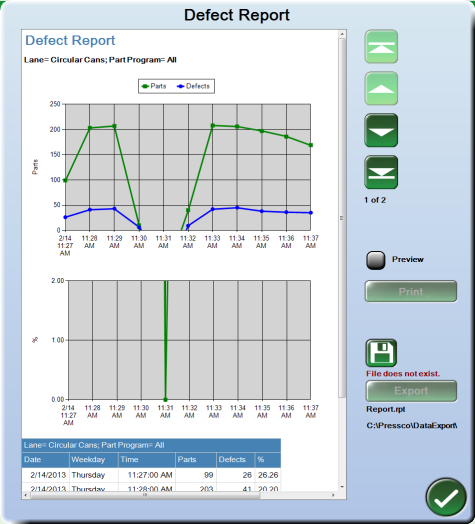
The example below shows a report with a time step of one minute. Use the buttons on the right side of the window to page through the reports.
Printing the report
Click the Preview button to enable the print function. A print preview is displayed. Use the Print button to print the report to the configured printer. (For more information, see Setting up a printer)
Saving the report to file
If you have not yet saved any reports, then a message stating "File Does Not Exist" is displayed below the disk icon.
To save a new report:
- Click the disk icon
 . The Select File window is displayed.
 - If desired, use the disk icon in the Select File window to browse to a different location on the hard drive, or a USB drive. Browse to the desired location and click the OK button to continue.
- Click the New button in the Select File menu to create a new report file name. The onscreen keyboard is displayed.
- Type the report name, and click the OK button to continue. A file is created at C:\Pressco\DataExport (or another location that you selected in step 2) but no data is saved yet.
- Click the Export button from the Defect Report window. The report is saved as a text (.txt) file and the file name contains lane, time interval, and time stamp information. You can use this data in your own spreadsheets or other databases to chart your plant's defect data.
To save new data to an existing report name:
You can use an existing report name to save more data to a new file. The last used report name is displayed under the Export button.
Click the Export button to save new data. The report is saved as a new text (.txt) file. The file name contains lane, time interval, and time stamp information. You can use this data in your own spreadsheets or other databases to chart your plant's defect data.
In This Section |
Print
|
Published: 7/29/2013 10:53:04 AM ©2015 ACME Ltd. All rights reserved. |
|